The day European Union governments spent the last of their annual revenues — 3rd edition
IEM Study

SUMMARY OF THE STUDY
Central governments are the main source of public deficits in the EU
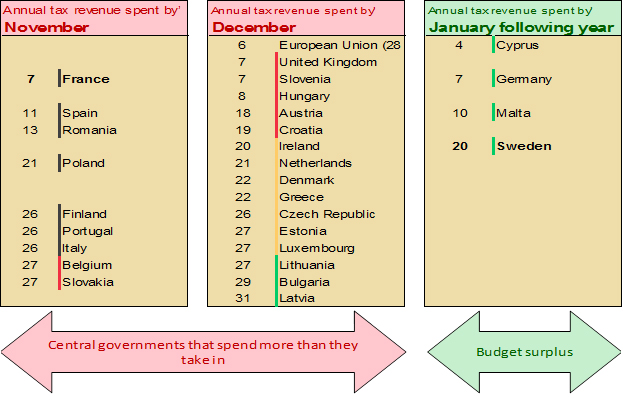
EU central governments use up their resources December 6 on average, 25 days before the end of the year. This is almost seven days later than the year before, representing a significant improvement.
Among the EU’s 28 central governments, four were in surplus last year, including Sweden, with a surplus equal to 20 days’ spending, and Germany, with a seven-day surplus. Their revenues for the year enabled them to finance all of the year’s expenditures and to lower their debt.
The 24 other central government spent the last of their revenues before year’s end. Fifteen of them had consumed their resources by December and nine of them by November.
Despite this improvement, central governments remain the dark spot in European public finances. Across the EU, central governments account for most of the slippage in public accounts, with 25 unfunded days. Local governments have been balanced since 2014 (with four days’ surplus in 2016). This is also true of social security administrations since 2016 (one day’s surplus). As a result, taking all administrations together, the various EU countries had consumed the last of their public revenues 13 days before the end of the year. This is five days later than the year before.
The French central government’s position continues to erode, unlike the rest of the EU
The French central government spent the last of its resources on November 7, or 55 days before the end of the year.
It now accounts for the greatest imbalance in the EU, ahead of Spain (50 days) and Romania (48 days). The gap is also growing between France and the EU average, climbing to nearly 30 days compared to 22 days the year before.
This weak performance is due to France’s inability to balance its accounts sustainably since the latest crisis. While EU central governments have used the last seven years to reduce their deficits, this is not what we see in France. The post-crisis balancing of accounts stopped prematurely, four years ago. The French central government’s deficit has gone higher again since 2014, at a pace of one more unfunded day per year, while the EU lowered its deficits by five days per year on average.
These disappointing results are causing France’s position to erode yet again. The most recent balanced budget produced by the government and the various bodies in the central government dates back to 1980. Since then, every budget has been in deficit, and the day when the last of the resources were consumed has climbed a day-and-a-half per year on average.
The central government is not alone in France in failing to balance its accounts. This is also true of the social security administrations. They remain in the red, despite an array of reforms aimed at controlling the rise in health care expenditures and at tightening pension plan operations.
PURPOSE OF THE STUDY
The purpose of this study is to compare central government revenues and expenditures in the 28 European Union (EU) member countries to determine the day they depleted their annual revenues and began to live on credit.
This study, covering all 28 EU countries, is based on the latest annual data from Eurostat, updated on October 23, 2017. It enables changes in imbalances to be measured over time and for each country’s situation to be compared.
This approach is intended to cast issues in a new light for ordinary citizens in an area that non-specialists may have trouble following.
Deficits are often expressed as percentages of GDP, which is not an easy concept to grasp. Debates on government budgeting involve billions of euros, whereas the general public is more accustomed to thinking in terms of hundreds or thousands of euros. In many cases, calculations of savings are presented by public authorities in relation to underlying growth assumptions rather than to actual expenditures. This blurs the way things are understood, since “savings” are not reflected automatically in lower expenditures.
We should add that debate on these complex topics often comes down to stances that are disconnected from the actual issues. This has been especially true in France over the last few years, with a proliferation of attacks on “budget austerity” that bear little relation to fact in a country where public spending does not decline in times of crisis and where it declines less quickly than elsewhere in times of recovery.
Hence the interest in an approach that enables the general public to get a clear and simple view of the scope of the issues and to follow how they change over time.
SPECIFICITY OF THE APPROACH
This study provides for a better understanding of central government slippage, put in current government language using a solid and accessible method. Revenues are divided by expenditures and multiplied by 365, enabling financial overruns to be expressed in days over a given year. This method is similar to usage in the financial sector, with analysts habitually presenting working capital requirements, for example, in days of turnover. It also has the advantage of making sense to anyone who has wondered how to make ends meet at the end of the month.
This work focuses on central governments, in other words government administrative bodies and other central bodies that normally have jurisdiction over a country’s entire territory. Across the EU, these are the administrations with the most unbalanced accounts. Nevertheless, the calculations also cover other administrations (state governments, local governments and social security funds). This provides added insight since, fortunately, not all countries run deficits in each of these administrations.
LAST KNOWN DAY ON WHICH EU CENTRAL GOVERNMENTS HAVE SPENT ALL THEIR RESOURCES
Calendar of dates on which central governments have spent all their revenues

INTERACTIVE MAP


