In 2024, France remains champion of compulsory taxation on the average wage earner, ahead of Belgium and Austria
Paris, July 17, 2024 – Using data calculated by EY, the Institut économique Molinari is issuing its 15th annual study on the real social and fiscal pressures faced by the average wage earner in the European Union (EU).
This ranking has the distinct feature of providing figures for the current year on the social and fiscal pressure faced by the average worker, applying a solid, uniform methodology across all 27 EU member countries. It provides a firm understanding of the real impact of taxes and social contributions and the changes they are undergoing.
France, Belgium and Austria in the top of countries that levy the most taxes on the average worker
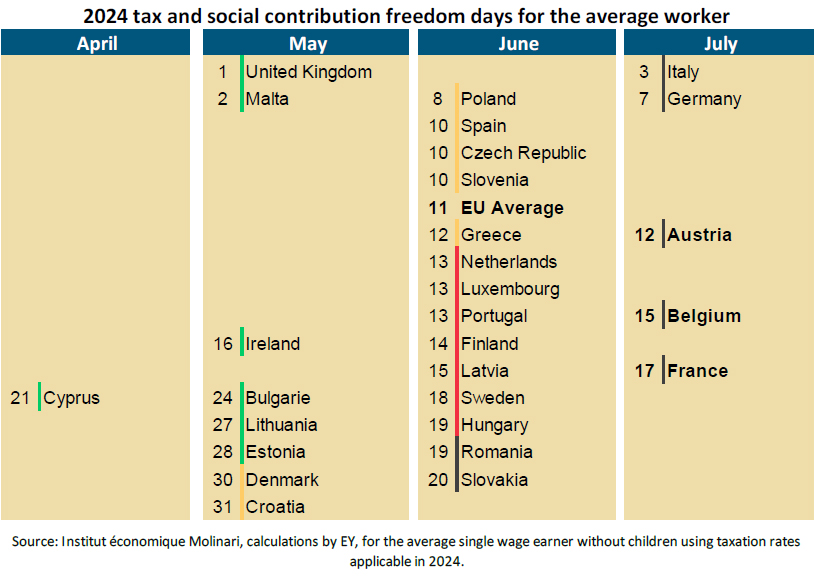
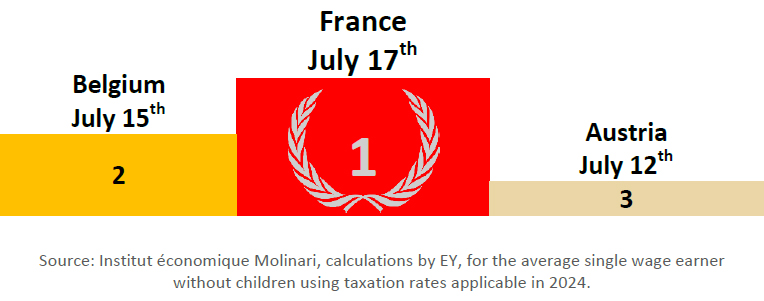
France is once again the EU’s champion for compulsory deductions in 2024, with social and fiscal liberation occurring only on July 17th. Until that date, the average single employee has no direct control over how the fruits of their labour are spent. France remains in the No. 1 position it held from 2016 to 2020 and in 2023. The tax burden on the average employee is 54%, down marginally compared with last year (-0.10%)
Belgium is second on the podium, with its social and fiscal liberation coming on July 15th. The former No. 1 in this ranking (from 2011 to 2015) became No. 2 (from 2016 to 2017) and then No. 3 (since 2018) thanks to its “Tax Shift.” Belgium remains No. 2 in 2024, with a social and fiscal pressure on the average employee of 53.5%, as last year.
In third place comes Austria, with its social and fiscal liberation also coming on July 12th, three days sooner than in 2023. Taxation of the average wage earner there stands at 52.9%, down significantly from last year (- 0.5%), thanks to lower income tax.
Germany comes in fourth, winning its tax freedom on July 7th with 50.9% taxation on the average employee.
Italy’s Tax Freedom Day of July 3th 7th with 50.4% taxation on the average employee puts it fifth and knocks it out of the club of countries over 50% taxation.
Over the past year, thirteen EU countries have seen increases in compulsory levies leading to a loss of between one and nine days of social and fiscal freedom. This was the case for Croatia, Greece, Ireland, Portugal and Slovenia (-1 day of fiscal and social freedom), Germany, Spain, Poland and the Czech Republic (-2 days), Luxembourg (-3 days), Cyprus and Malta (-5 days) and Finland (-9 days).
Eight countries are stable: Belgium, Bulgaria, Denmark, France, Hungary, Italy, Latvia and Romania.
The rest of the EU is experiencing year-over-year decline in taxes and social security contributions giving back at least one day of social and fiscal freedom. This is the case in Lithuania and Slovakia (+2 days), Austria, the Netherlands and Sweden (+3 days), and Estonia (+4 days).
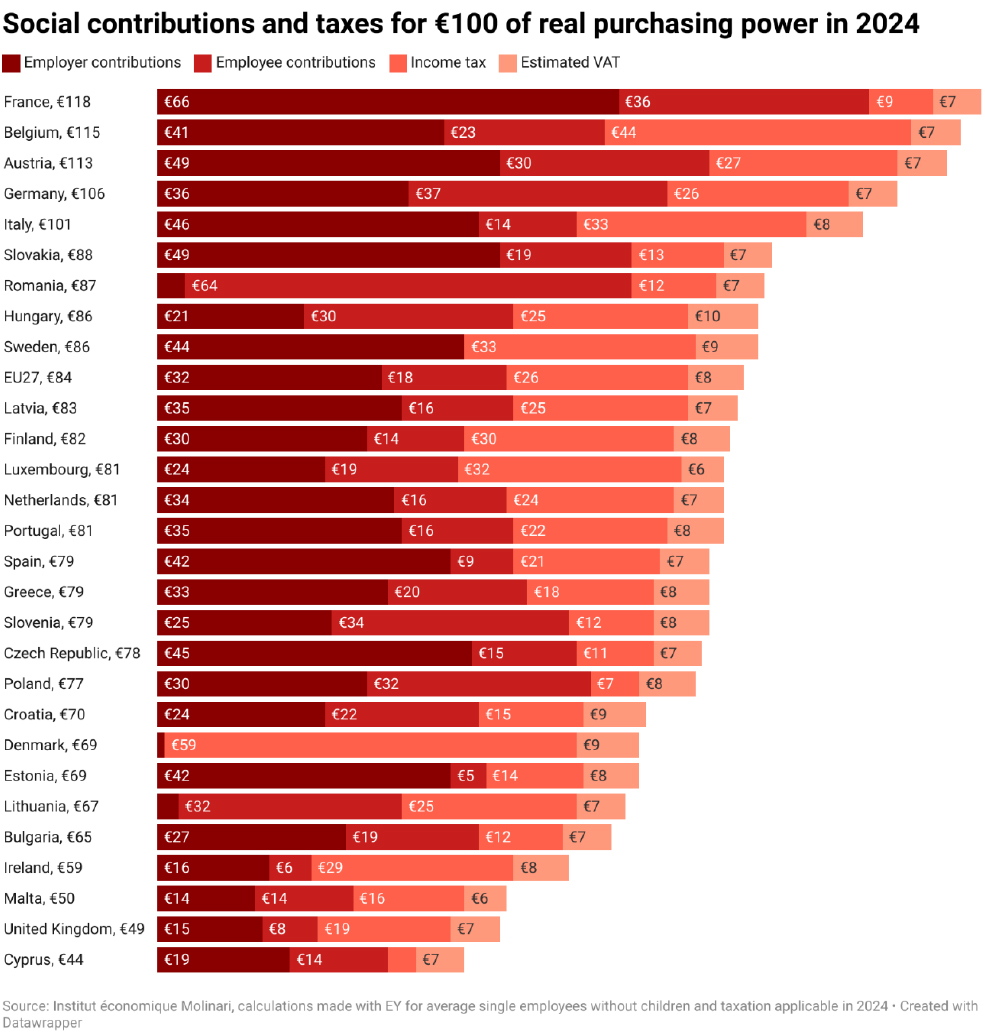
In 5 European countries, taxes and social security contributions are higher than disposable income
Before they achieve €100 of real purchasing power, the average French employee must first pay €118 in taxes and contributions, this compared with €115 in Belgium, €113 in Austria, €106 in Germany and €101 in Italy. By comparison, the EU average is €84.
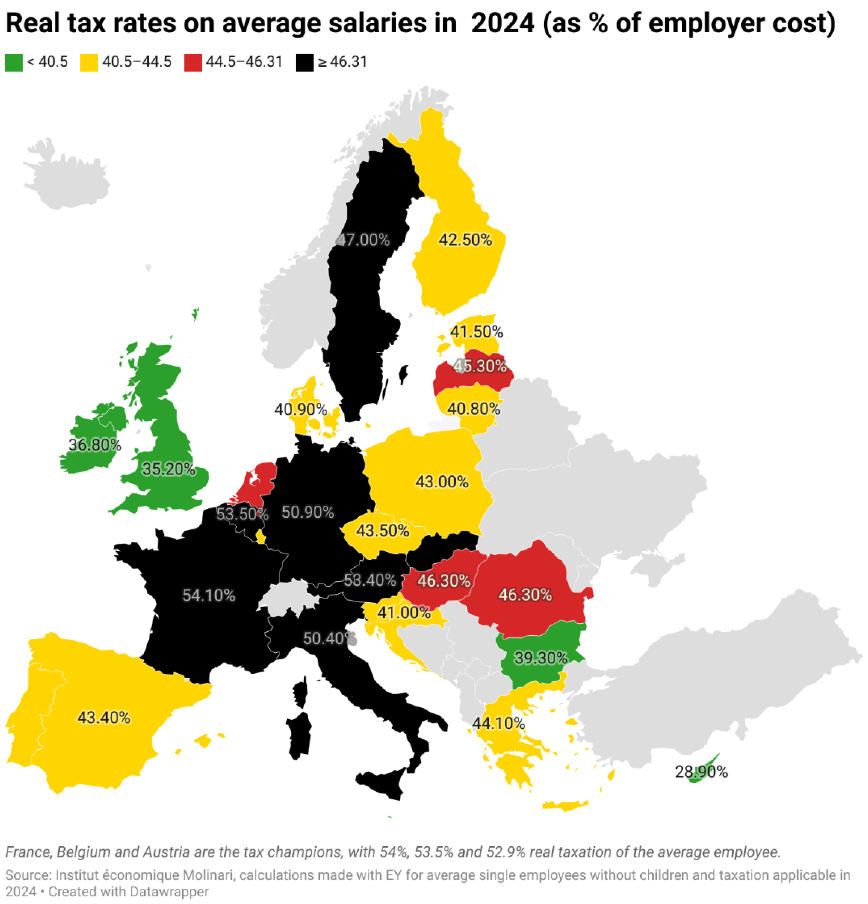
For the average employee in the EU, the real tax rate continues to fall down by 1.3% since 2014
In 2024, the effective tax rate for employees in the EU-27 is 44.3%, up by 0.2% from 2023 and down by 1.3% from the peak in 2014.
In concrete terms, an average employee generating €100 of income before tax and charges will have to pay €44.30 in compulsory deductions in 2024. Ultimately, they will have €55.70 of real purchasing power at their disposal. This is €0.20 less than in 2023 and €1.30 more than in 2014 and as much as in 2010, when the barometer was first published.
For France, €32 132 in compulsory levies thus a tight purchasing power
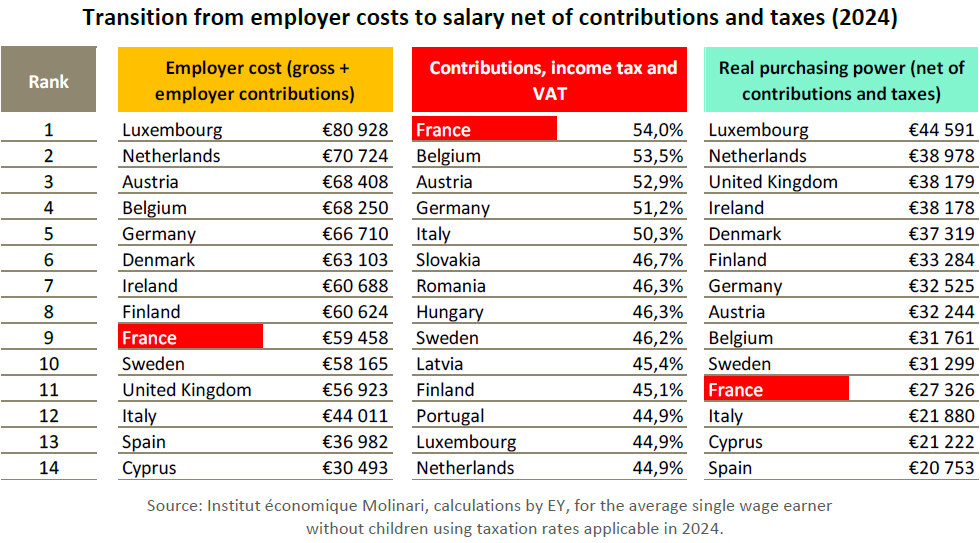
The average French employee costs his employer €59,458 (9th in the EU), but this work is so heavily taxed (54%) that they are left with just €27 326 net of compulsory deductions (11th in the EU).
Most of the taxes paid by the average employee are employer contributions (56%) and employee contributions (31%), with income tax (7%) and VAT playing a lesser role (6%).
In France, social security contributions (€27 782) are higher than net pay (€27 326). They represent 101% of take-home pay, the highest average in the EU at 48%.
So, while employers in France face labour costs on a par with those of the northern countries of the EU, the average employee has a net salary that is intermediate between those of the northern and southern countries.
Despite France’s high level of taxation, future pensions will be average and education ranks 18th out of 27 EU countries
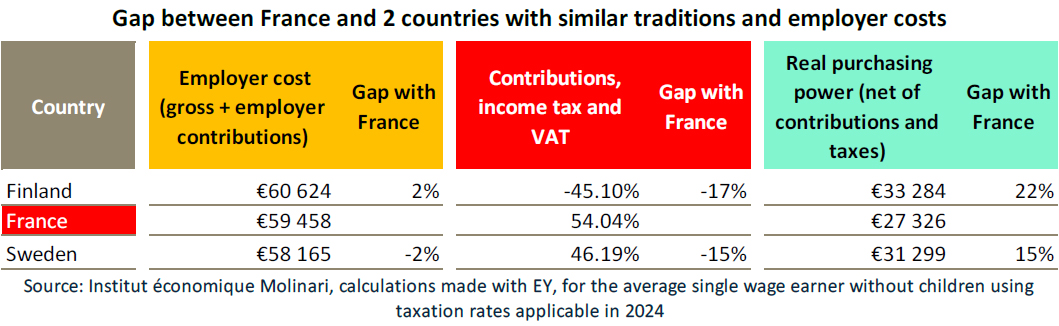
The purchasing power of the average French employee is more restricted than in countries with a Beveridgian social tradition (United Kingdom and Ireland), but it is also lower with respect to northern countries with similar social traditions to ours.
For the same employer costs, the average French employee earns 15% to 22% less net salary than the equivalent Swede or Finn who also enjoys significant social benefits and public services.
The IEM’s study shows that French social and fiscal burdens cannot be explained by more attractive public services. French social and public benefits are not known for being “a good bargain.”
This is particularly true with respect to pensions, which account for 24% of public spending and €11,500 in social security contributions for the average employee:
- Funded almost exclusively on a pay-as-you-go basis, these yield lower returns than in countries where contributions are supplemented by savings. They cost French employees 30% more, with contributions representing 28% of gross salary compared with an EU average of 21%, for an additional gain of 6%, with a future replacement rate of 72% compared with 68% in the EU.
- Compared with employees in the Danes who benefit from pension funds, the shortfall is quite significant. The net replacement rate should be 12% lower in France (68% of net in France vs. 77% in Denmark), while employees contribute twice more (28% of gross in France vs. 13% in Denmark).
Value for money is also mediocre in education. Despite major collective investment – with 9% of public spending and 180 billion euros per year including businesses and households – France’s position is deteriorating:
- In the PISA 2022 rankings, France is 15th out of 27 EU countries in mathematics, 16th in reading and 14th in science.
- According to our research, France ranks 18th out of 27 EU countries when it comes to the efficiency of education and training expenditure. If it were to move closer to the most efficient countries, the same results could be achieved by saving 16 billion euros, or 9% of domestic education expenditure each year.
Higher taxes do not imply greater well-being
This study demonstrates that the social and fiscal burden in France is not synonymous with a better quality of life. It shows, rather, that life satisfaction is better in twelve countries with lower tax burdens: Austria, Belgium, Czech Republic, Denmark, Finland, Germany, Ireland, Lithuania, Luxembourg, Netherlands, Slovenia and Sweden.
ABOUT THE TAX FREEDOM DAY
The tax and social contribution Freedom Day is the date when the average employee stops, in theory, paying compulsory social contributions and taxes and can use the fruit of her labour as she pleases.
This indicator measures the date starting on which the employee becomes free to apply the fruits of her labour in the way she wishes and not the date starting on which the employee may stop “working for society.”
The particularity of this indicator of economic freedom is that it puts the situation of average EU wage earners in tangible form by bringing together each country’s taxation of labour (social contributions and income tax) and of consumption (VAT). Calculations of employer and employee social contributions and of income taxes are done by EY for each of the 27 EU countries.
QUOTES
Nicolas Marques, general manager of the Institut économique Molinari, co-author
“Average French employees are still the most heavily taxed in Europe, ahead of the Belgians and Austrians. Their purchasing power is more constrained than anywhere else in Europe.”
“Over time, average French workers have become the leaders in compulsory contributions, resulting in limitations on their purchasing power.”
“It is an illusion to think that companies can achieve structural correction of this situation by increasing wages. Taxes and contributions account for 54% of gross pay, and when an employer pays an extra €218 to an employee, the latter receives only €100 once compulsory contributions have been paid.”
“To restore purchasing power for employees, we need to have the courage to face up to the structural challenges facing France with systemic reforms, such as the generalization of capitalization, enabling us to maintain the purchasing power of retirees without sacrificing that of employees.”
“In neighbouring countries, notably Denmark, a significant proportion of pensions are financed by capitalization. This makes financing pensions less costly, increases the purchasing power of both working people and retirees, and reduces wealth inequalities by sharing added value even more widely.”
Cécile Philippe, president of the Institut économique Molinari, co-author
“Contrary to popular belief, high social contributions and taxes are not an indicator of better public services.
“French pensions, which absorb 24% of public spending, are more costly than in European countries that rely on both pay-as-you-go and pension funds (the Netherlands, Sweden, etc.).
Health and health insurance, which absorb 20% of public spending, suffer from overcrowding and an absence of innovation and prevention.
Spending on education, which accounts for 9% of public spending, is poor value for money, with inefficiency of the order of 9%.”
“In a number of key areas, the public is witnessing a deterioration in service levels, despite record levels of taxation.”
“To spend money wisely, one must have to have the courage to verify the value achieved for price. But we have lost the habit of taking this common-sense approach and of correcting course when the value for money in collective services is inadequate.”
James Rogers, associate researcher at the Institut économique Molinari, co-author
“Despite the good news, French, Belgian and Austrian wage earners are still devoting more than half of the amounts distributed by their employers to social contributions and taxes.
“It’s worth asking why they are not getting the top schools, the best health care and the most generous pensions in return and why they are not the leaders in indicators of human development or well-being.”
RESOURCES
The study, La pression sociale et fiscale réelle sur le salaire moyen au sein de l’UE en 2024 (15ème édition) is available at the links below in French at: https://www.institutmolinari.org/wp-content/uploads/2024/07/etude-fardeau-fiscal-eu-2024.pdf
A Datawrapper map is available: Real tax rate for the average employee in 2024
https://www.datawrapper.de/_/c6sAX/
As well as 3 Datawrapper tables:
- Taxes and contributions per €100 of real purchasing power in 2024: https://www.datawrapper.de/_/P8M4z/
- Distribution of contributions and taxes on average employees in 2024 : https://www.datawrapper.de/_/CEou2/
- Shift from employer cost to purchasing power in 2024: https://www.datawrapper.de/_/xTchp/
ABOUT THE INSTITUT ÉCONOMIQUE MOLINARI
The study was written by Nicolas Marques, Cécile Philippe and James Rogers of the Institut économique Molinari (IEM).
The Institut économique Molinari (Paris and Brussels) is an independent research and education organisation. It seeks to stimulate the economic approach in the analysis of public policy, offering innovative alternative solutions that favour the prosperity of all individuals making up society.
FOR INFORMATION OR INTERVIEWS, PLEASE CONTACT THE AUTHORS
Nicolas Marques, General manager of the Institut économique Molinari (Paris, French),
nicolas@institutmolinari.org, +33 6 64 94 80 61
Cécile Philippe, President of the Institut économique Molinari (Paris, French or English), cecile@institutmolinari.org, +33 6 78 86 98 58
James Rogers, Associate researcher at the Institut économique Molinari (Brussels, English),
james@institutmolinari.org, +32 497 946 840